Insert your catchy page header here.
Enhance your content with a compelling subtitle. Clearly describe the purpose or theme of your page. Engage your audience right from the start.


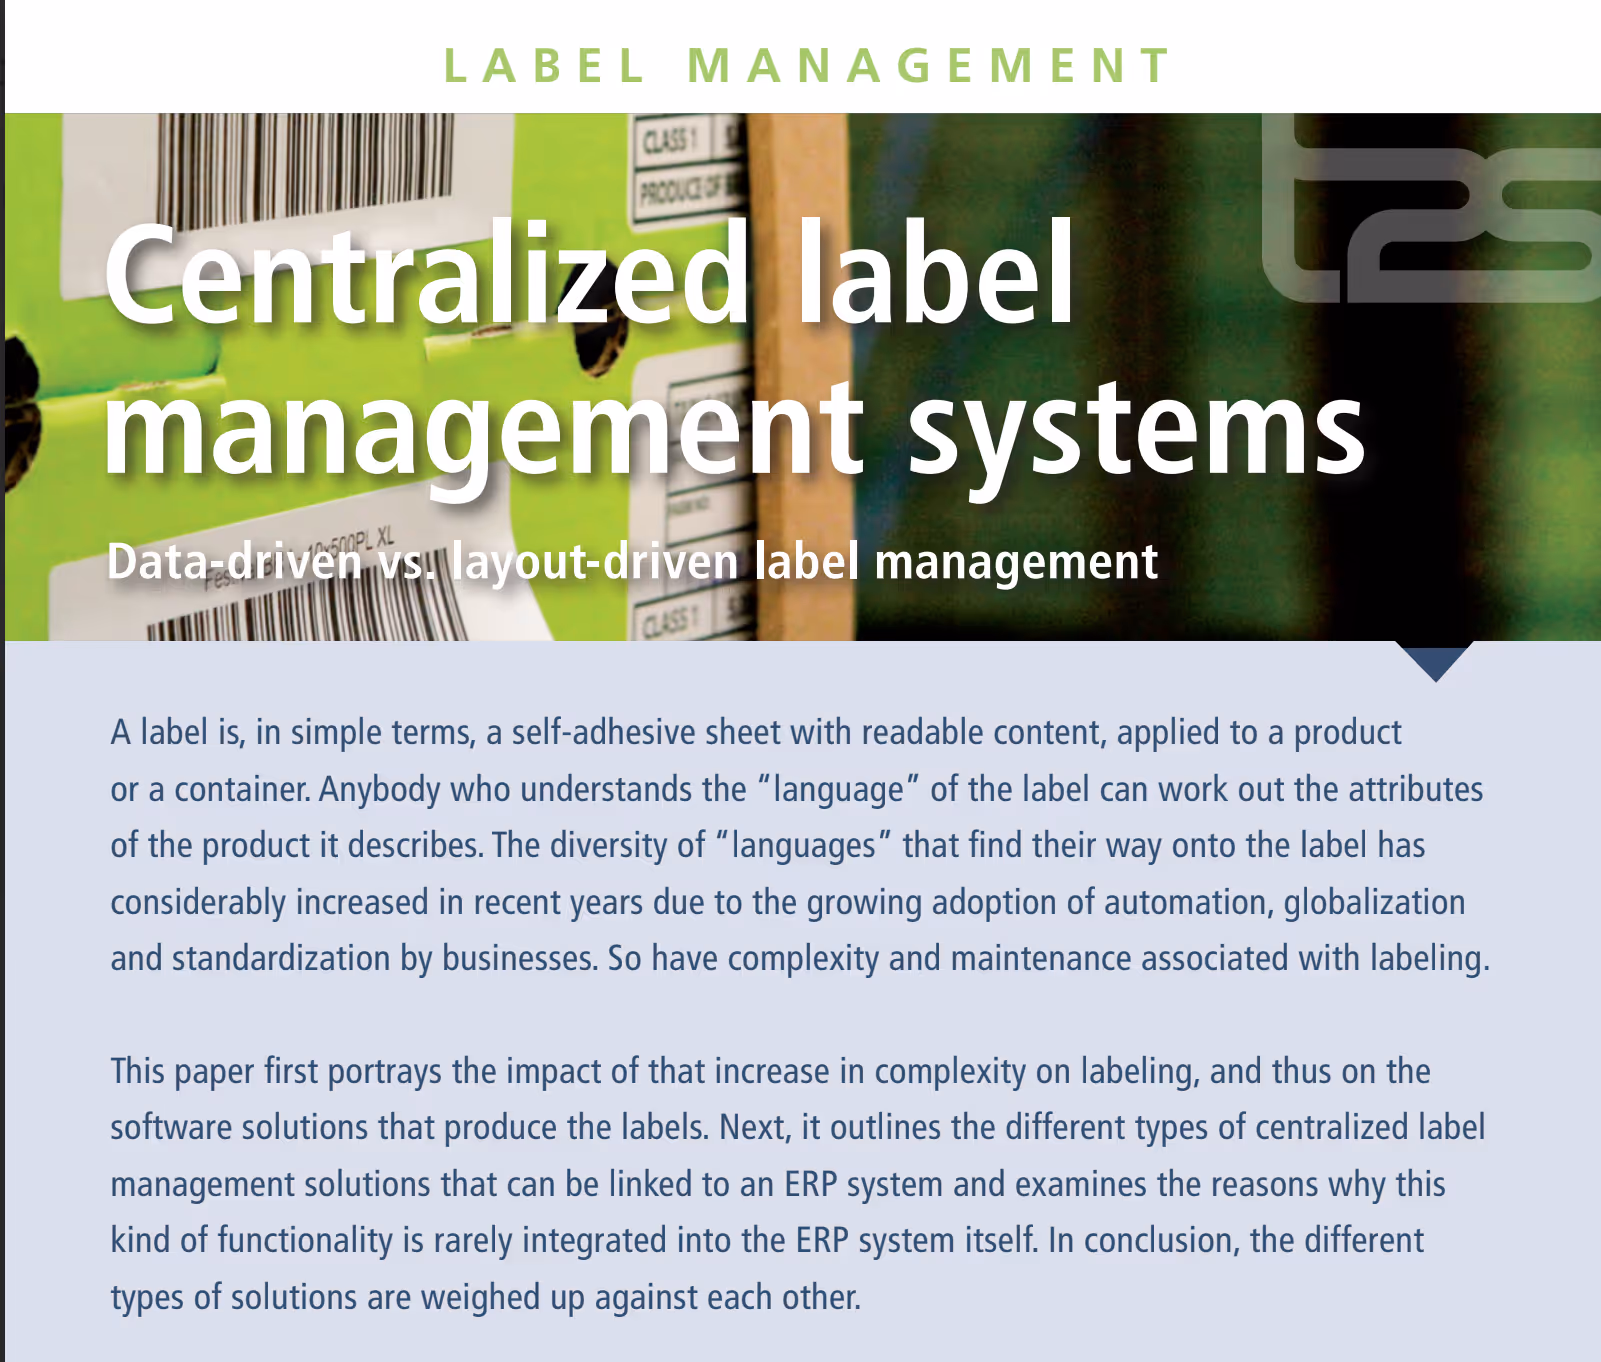
Dashboard
Guard the quality standards for newly-entered data. Keep exceptions to these standards in plain view.
Boost results
Enhance results with accurate, complete, and current data, leading to reliable business operations.
Manage
Track the level of data quality over time. Organize your monitored data by topic for easy access.
Optimize
Optimize data in a targeted manner. Annoying Excel lists are a thing of the past.

Create a descriptive heading with four to nine words.
Lorem ipsum dolor sit amet. Aut voluptatem iure hic blanditiis ipsam ad itaque suscipit aut autem quis sit obcaecati nisi 33 quam maiores. In molestiae atque quo doloremque totam ea dolores iusto qui quia repellat et voluptatem sunt qui repellat alias a culpa perspiciatis.
Create a descriptive section heading.
Enhance your content with a compelling subtitle. Clearly describe the purpose or theme of your page. Engage your audience right from the start.
1. Data collection
Define the kind of data to be collected and the elements within that data which should be optimized.
2. Define rules
Define rules for each data element and automate the control mechanisms.
3. Data steward
Assign the responsibility for the optimization of a data entity to a single person.
4. Automate
Automate data validation according to their definition, and store results automatically with the data quality dashboard.
5. Correct
Correct exceptions and adjust their definition if necessary.
6. Load
Lorem ipsum dolor sit amet, consectetur adipiscing elit.
Meet our experts
The T2S data specialists have extensive experience with data migrations and data integrations in various sectors, such as the financial sector, government, energy & multimedia, construction, healthcare, food and chemical industry.


Contact us
Please fill in the contact form below, and tell us how we can help you. We will get in touch with you within one business day!

.avif)
.avif)


Frequently Asked Questions
Lorem ipsum dolor sit amet, consectetur adipiscing elit. Suspendisse varius enim in eros elementum tristique. Duis cursus, mi quis viverra ornare.
What is a data quality dashboard?
A data quality dashboard is a fast and easy tool that tracks the quality of your data. It helps you to tackle data quality issues and gives you clarity. The clarity is not just there for a week or a month; using a data quality dashboard leads to continuous improvement of your data.
What are the advantages of a data quality dashboard?
A data quality dashboard provides that kind of insight that makes it possible to improve, maintain and optimize data quality. Over time, the facts keep adding up, and you get progressive insight. It empowers you to steer by the realities in your data. You will get the peace of mind that comes with being in control.
How can I check the quality of my data?
You can check the quality of your data real-time in the dashboard. Your data is extracted from the data source of your application(s). This data is automatically evaluated by the data quality dashboard, according to the business rules resulting from the data definitions. Exceptions to those business rules are detected, collected, and presented to the data owner in the dashboard. The data owner can take appropriate corrective action, either by correcting the data, or by fine-tuning the data definitions.
What is data quality with example?
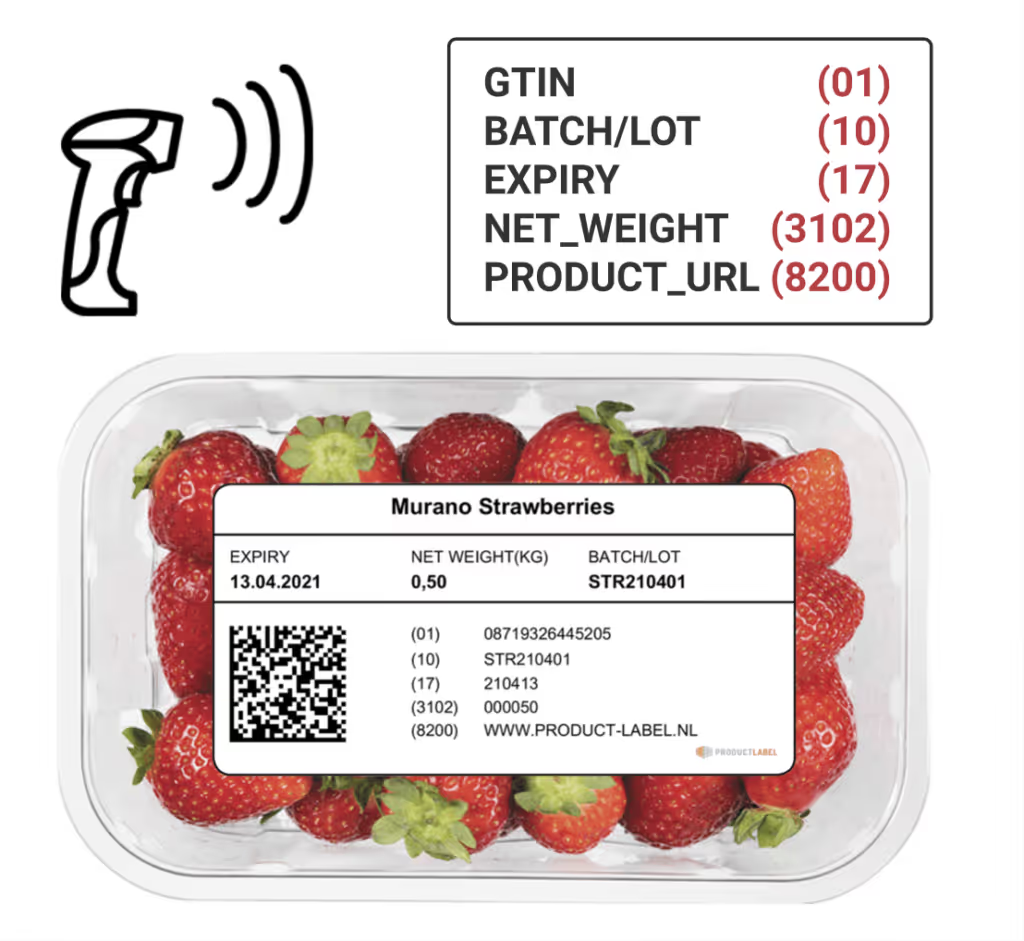
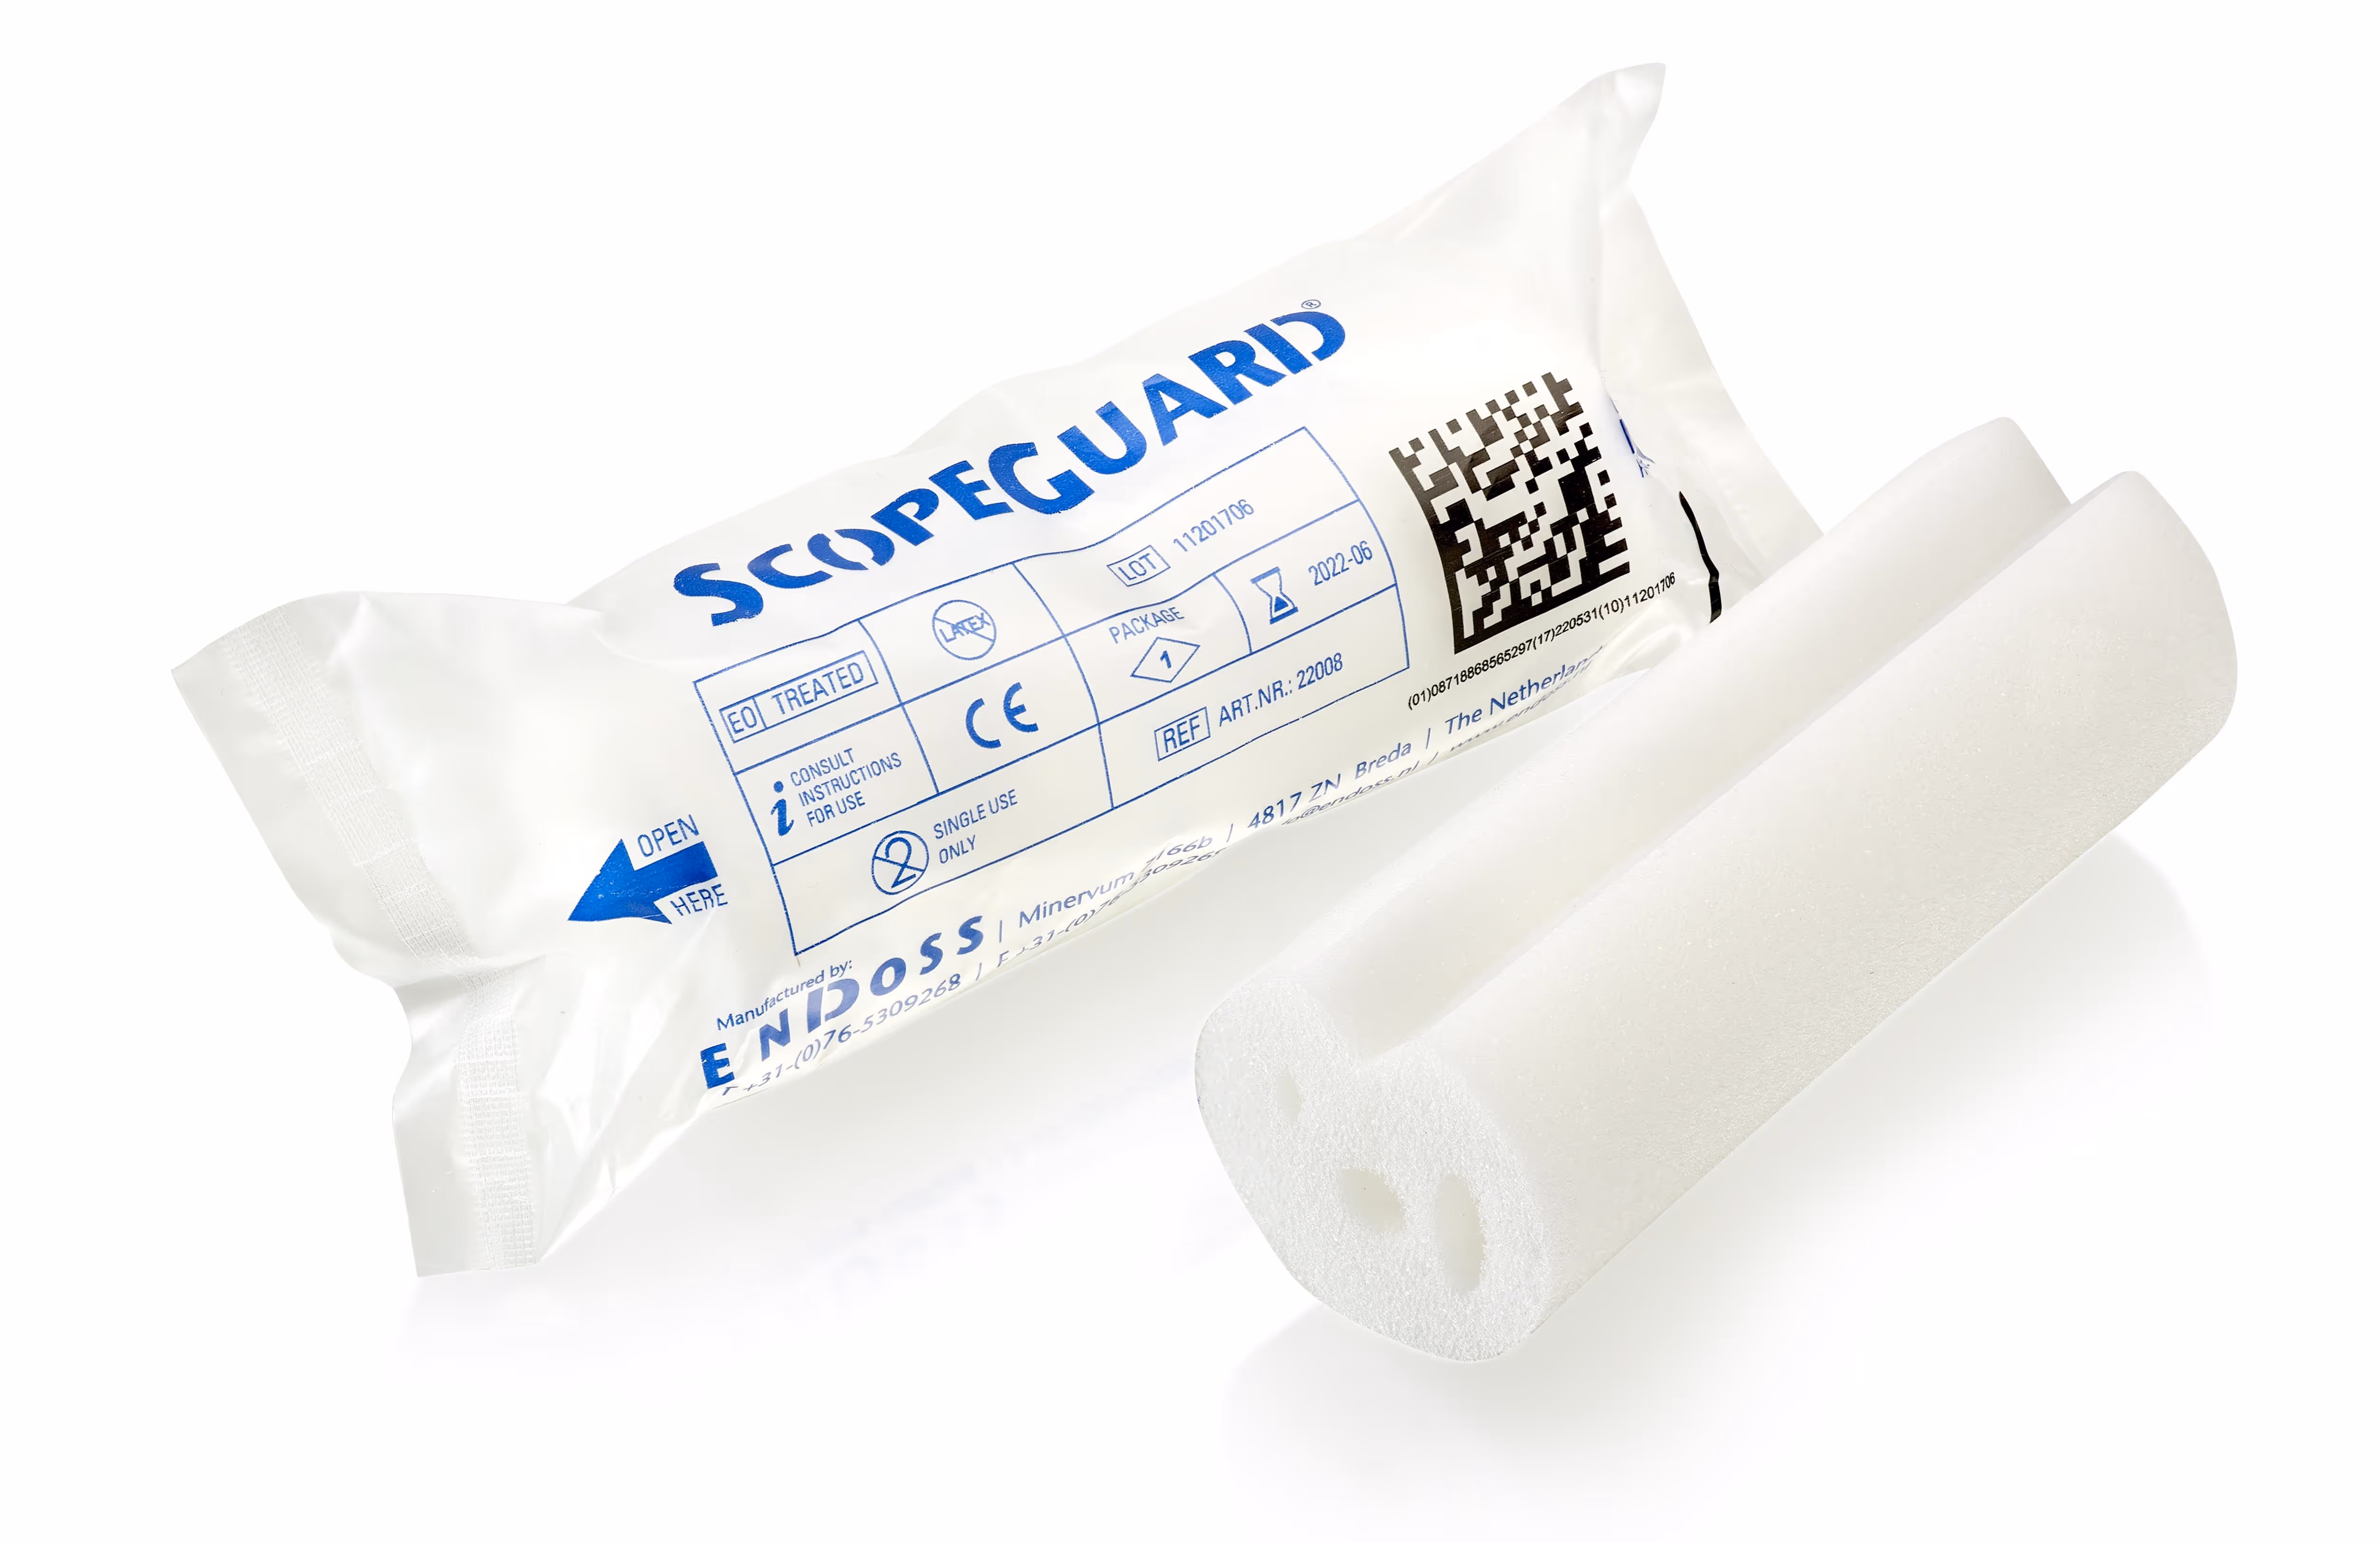
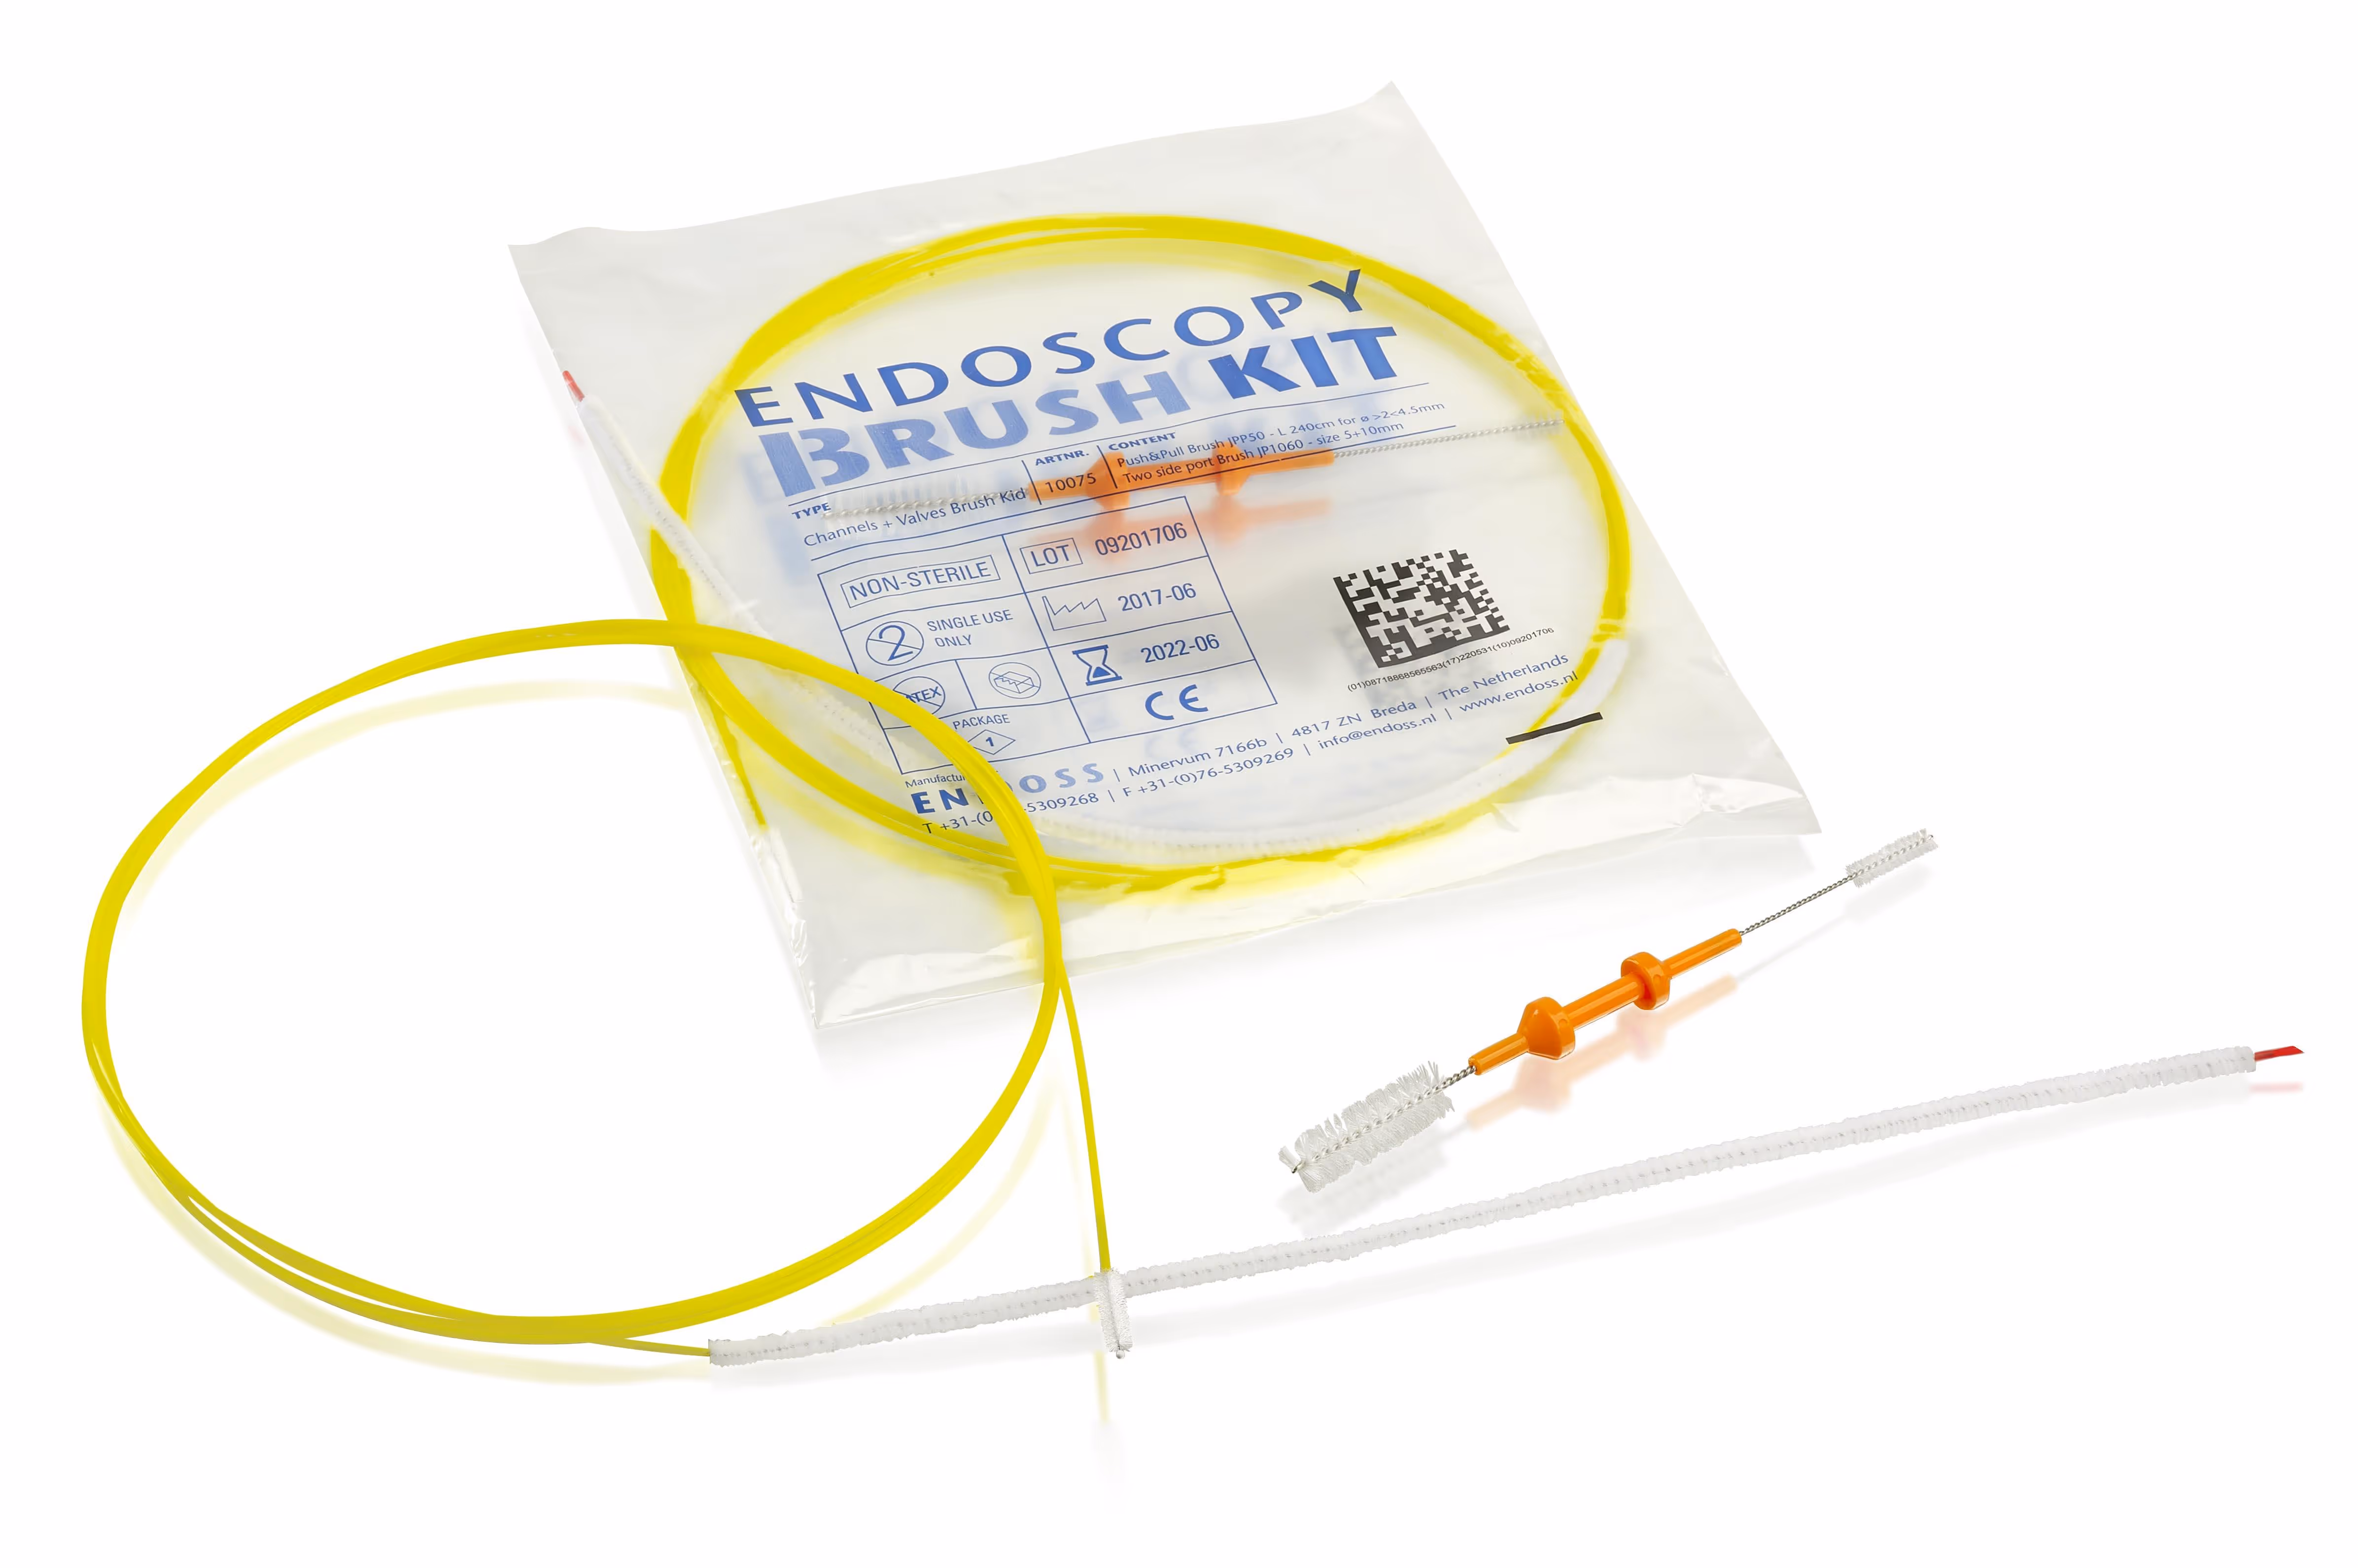
Data quality is a measurement of how fit a data set is to serve the specific needs of an organization and preferably a bit more. What matters is whether the data you register is correct, complete and fit-for-purpose. But this is changing rapidly, especially nowadays. It is therefore possible that the quality is 100% (correct and complete) today and will no longer be tomorrow due to changed market conditions (fit-for-purpose). You can think of the e-commerce requirements of new customers and other buyers. This increases the data requirement such as photographic material, additional product features and data required in electronic communication.
What is data quality optimization?
Data quality optimization is a continuous process. A quick one-time cleanse will get you back right where you were in no time. Data is like a living organism, it is constantly moving and evolving. Therefore, constant monitoring and cleansing are necessary. The optimization and above all the preservation of data quality requires discipline and planning. Companies that continuously improve the quality of their data can gain strategic advantage and provide greater value to their customers.